Ascelpius™
VIDEO OVERVIEW (1.75 Minute Video)
(Be sure to run the video in fullscreen by clicking on the icon below.)
VIDEO OVERVIEW
QUICK SUMMARY
SLIDE SHOW
KEY BENEFITS
KEY SOFTWARE FEATURES
KEY ANALYSIS FEATURES
WHAT'S UNDER THE HOOD?
(TECHNOLOGIES VIDEO)
PRICING
FREE DOWNLOAD 15 DAY TRIAL
USER MANUAL: READ OR DOWNLOAD
CONTACT / QUESTIONS
VIDEO
CENTER
CONSULTING
PLATFORMS
SOFTWARE
SOLUTIONS BY INDUSTRY
QUICK SUMMARY
What if :
- An advanced survey could accurately capture the importance of each level of each feature in the market for each customer...by reproducing the purchase trade-offs customers make in real life?
- Those feature importance values could be combined with feature thresholds into an E-customer that was calibrated to make the same choices as the physical customer?
- Enough individual survey data was collected at VERY low cost to fully represent your market?
Then:
- You could cut your survey costs by 90%...because your calibrated E-customer could be repeatedly presented with new product ideas...and never get tired.
-
The industry's most accurate market simulator could present any product....in any configuration... to your E-customers...and identify:
- The most preferred product configuration(s) in the market (Preference modeling)
- The configuration(s) that causes the most non-customers to switch to you (Switching modeling)
- The configuration(s) that maximizes retention (Retention Modeling)
- The configurations(s) that best protects you against competitive attacks (Blunting modeling)
- The configurations(s) that maximize market share at the least cost (Price Partial modeling)
Moreover, what if:
- The system that did all this was designed to be turn-key? To be run by non-experts in house?
-
The technology behind the system was market-leading? What if it:
- Used a proprietary trade-off surveying methodology
- Used goal solving and multiple algorithms to develop the optimum decision driver (utility) set?
- Automatically performed data mining to test hundreds of million of combinations of market segments to find undiscovered patterns of preferences?
- Automatically built and tested hundreds of millions of products to find the optimal product for each modeling outcome above?
What would you have? You would have ProductSolve™ a decision support platform that uses the captured decision drivers of the market's customers to discover how to build or redesign products customers really want.
That survey could also capture threshold information to discover all possible feature combinations sufficient to cause any customer to purchase...or retain...or be satisfied?
SHOW ME! (Slide show)
(Click on the first icon below to start the slide show.)
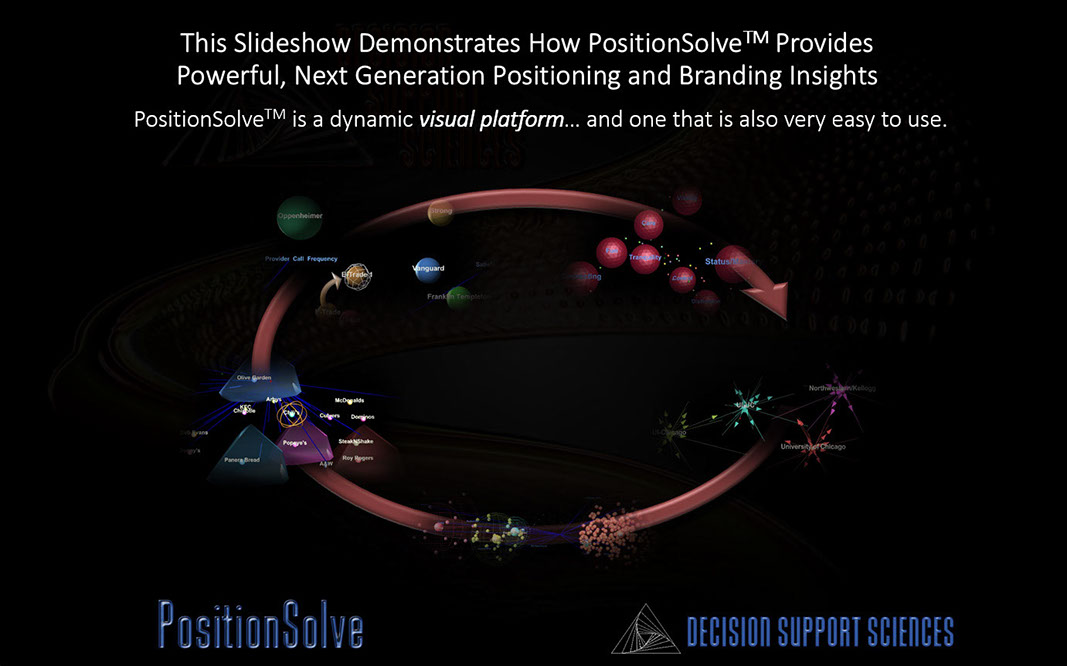

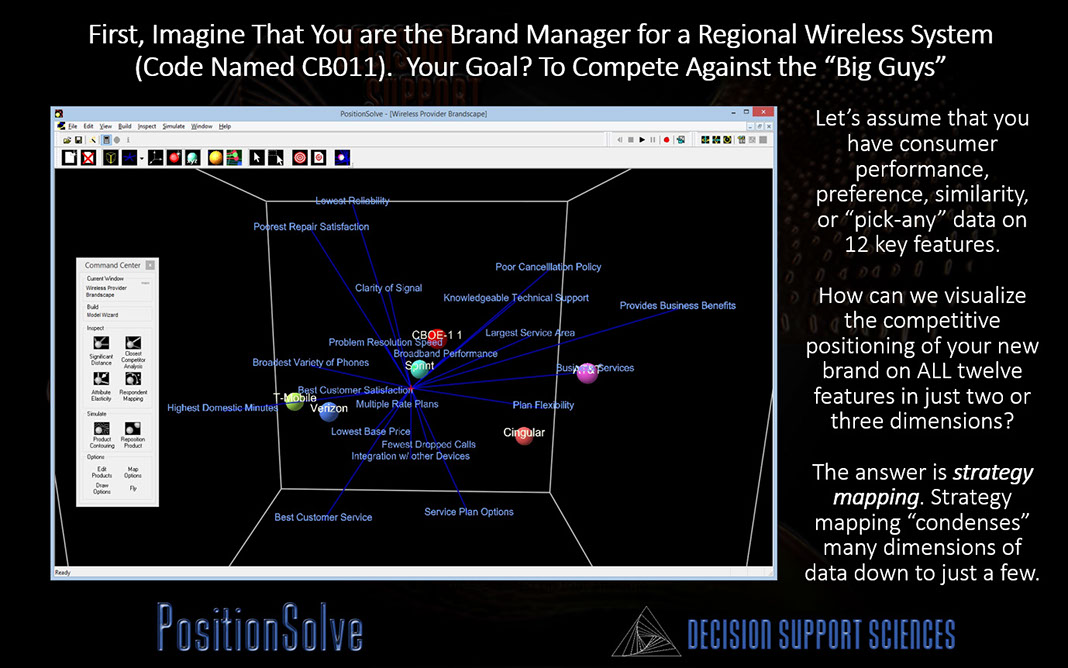




<
>
1 - 2
x
Close and Return
KEY BENEFITS (Place your pointer over the benefits to see the short description.)

PositionSolve™ is not only visual (it compresses relevant information into a 3-D strategy map) it is dynamic. That is, PositionSolve™ lets the strategist "what-if" with the a product's characteristics to see how those changes vary the positioning, preference and demand share of ANY competitor. Above is only one of many analyses of PositionSolve™, a map of products (in this case from the beverage industry) in relationship to the segments from that same industry.

One of PositionSolve™'s primary strengths is optimization. Above is an actual real time screen capture from PositionSolve™'s run optimizer. Notice first that PositionSolve™ is fast. 248 Discriminant Analysis models were run in 9 seconds on a modern laptop. But more importantly, notice that the correct classification percentage increased from 50% to over 75% by transforming the predictors and eliminating those that do not meet entry and removal criteria. Optimization is PositionSolve™'s middle name!

PositionSolve™'s dynamic capabilities include automated and directed product movement on the strategy map. In directed movement the strategist "drags" a product to a new position using competitive repositioning (CR). In CR the system mathematically solves for all the possible ways to arrive at that new location. In automated movement the system runs millions of changes to a given product to discover its competitive niche (CN). See the competitive repositioning (CR) and competitive niche (CN) benefit analysis descriptions below.

PositionSolve™ allows the strategist to understand which competitors are truly closest to one another when ALL the dimensions of the data are considered rather than just the primary "mappable" dimensions (which DO, by the way express the maximum information).

PositionSolve™ allows the strategist to understand the limits of the product's competitive movement given that only one attribute is changes at a time. To understand what happens when two or more attributes are changed, inspect Competitive Niche Analysis.

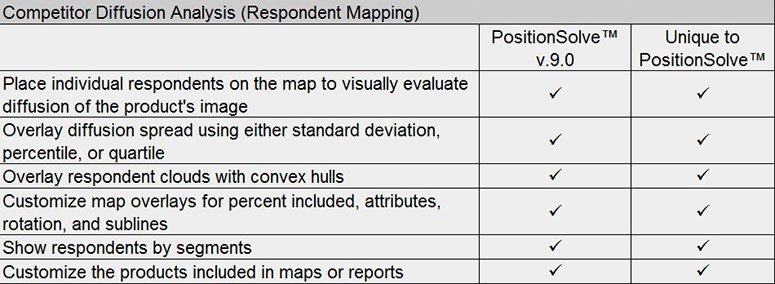
PositionSolve™ visualizes whether the brand image of the products in the competitive set are tight and focused or it is diffuse. It does this by plotting respondents themselves on the competitive space and seeing how tightly they cluster around their own brand. Larger spheres indicate a more diffuse, less clear brand image in the marketplace.
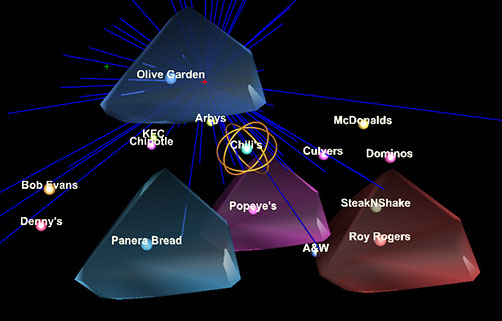
PositionSolve™ performs competitive niche analysis by running hundreds of thousands of simulations for each product to see how "far" it can move from its current positioning. The limits of a product's movement defines its realistic product niche. When products do NOT overlap they are in isolated niches.

PositionSolve™ allows the value, perceptual or preference-based segments to be overlaid on the product space. These segments can be developed by standard cluster or factor analysis methods or by using the attribute clustering capability within PositionSolve™. The red spheres above are segments overlaid on the brand space. The smaller colored spheres are the brands in the brand space.
PositionSolve™ allows the strategist to "drag" any given product to a new position on the strategy map and the system will mathematically solve for ways to arrive at that new location.

InnovationSolve™, a superset of PositionSolve™ adds demand to the brand landscape. Demand is the missing link in most strategy systems. Demand (seen here as the bright semi-transparent spheres) tells us where we should build new products as well as telling us HOW we should message that new innovation so that latent demand gets actualized into market demand.
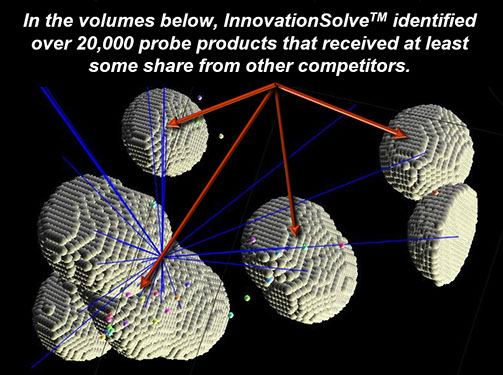
InnovationSolve™ probes into every point in the demandspace to find if building a product there with either create new demand or win share from existing competitors. Then that product is built in the ProductSolve™ simulator to identify how much preference share and dollar volume opportunity the product will earn when launched.
Visual and Dynamic
Generates Optimal Strategy Maps
Performs "What-iffing" Simulation (Repositioning and Simulation)
Finds Closest Competitors / Risks
Finds Limits of Competitive Movement
Quantifies Brand Image Diffusion
Performs Competitive Niche Analysis
Overlays Segments on the Space
Performs Competitive Repositioning
Performs Innovation Analysis (Moves into Areas of Maximal Market Demand)
Identifies Maximal Demand Improvement at the Lowest Cost
<
>
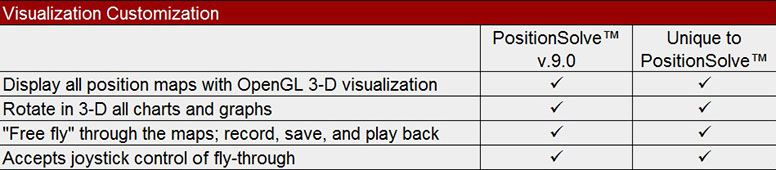
KEY SOFTWARE FEATURES
(Click on the plus signs below to expand.)



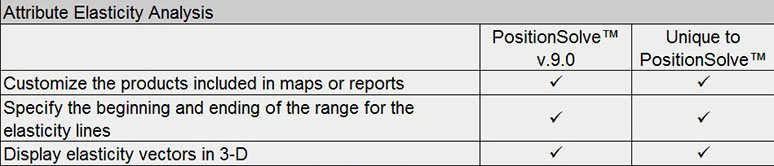
KEY ANALYSIS FEATURES
(Click on the plus signs below to expand.)



WHAT'S UNDER THE HOOD? (Enabling Technologies Video)
(Be sure to run the video in fullscreen HD by clicking on the icons below.)
PRICING
FREE Asclepius™ DOWNLOAD AND 15 DAY TRIAL
Asclepius™ USER MANUAL REVIEW AND DOWNLOAD (PDF)
Click here to download the PDF
Download the Asclepius™ User Manual (2MB PDF)



































